Trust but Verify
How do you know what you know?
The original Jegadeesh and Titman momentum paper (pdf) is often used as a template to setup momentum portfolios. Pretty much everybody follows the 12_1_1 config: a 12-month formation period that skips the closest month and rebalances every month. And looking at our own momentum portfolios, we somehow made the decision about a decade ago to having 20 stocks by default. But are these ideal? Where did these numbers come from?
Often, the base layer gets obscured by the abstractions we have built over them. The documentation gets lost and the institutional knowledge fades. So, it makes sense to revisit old assumptions that hold these layers together and make sure that they still make sense.
We spent the last couple of weeks just running the numbers on simple momentum portfolios and publishing them on github so that a permanent record of the rationale behind these choices exist.
Skip Month: One or Two months, doesn’t matter. But skip, you must!
Rebalance Frequency: One month is ideal. But 6-months works too.
Formation Period: This is all over the place. 12 is a magic number.
Portfolio Size: 20 or even 30 stocks will do the trick.
And if all this looks daunting and you just want some basic momentum exposure, then UTI’s Nifty200 Momentum 30 Index Fund and Tata’s Nifty Midcap 150 Momentum 50 Index Fund are good places to start.
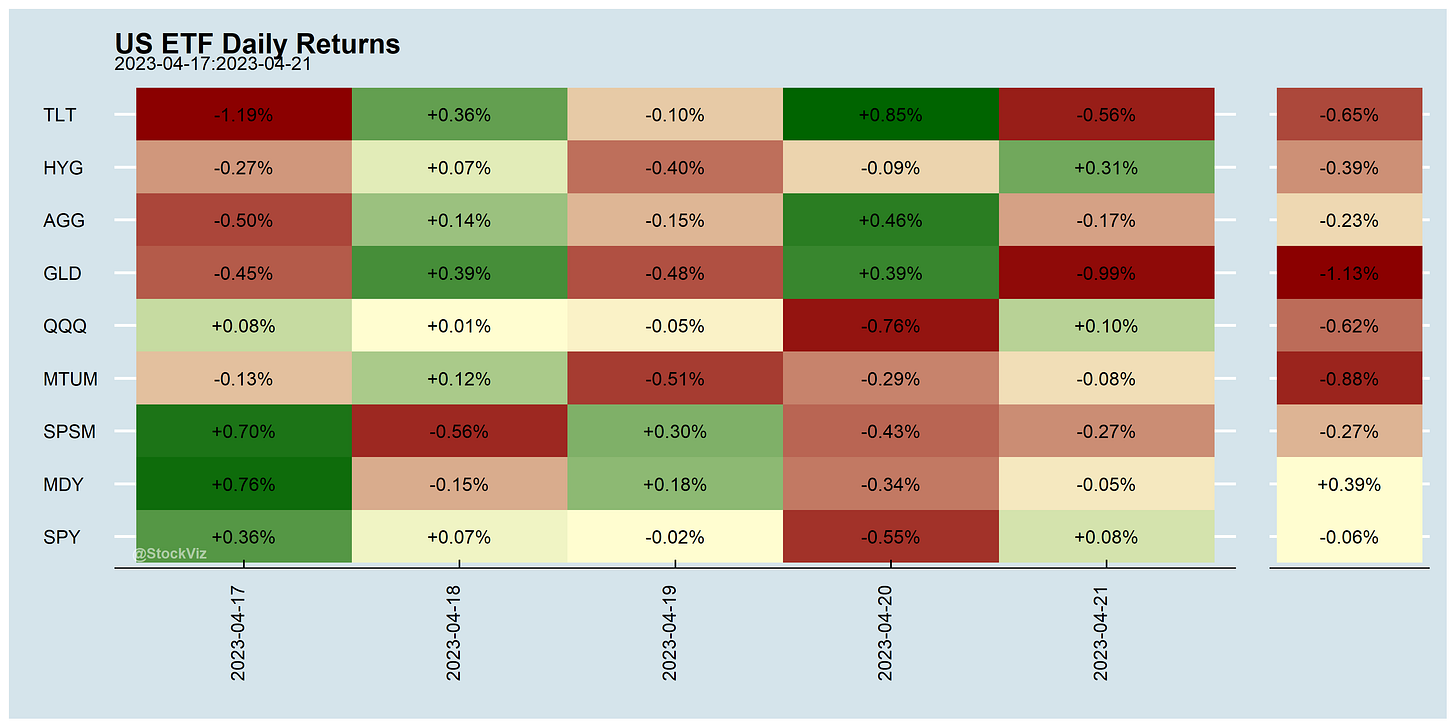
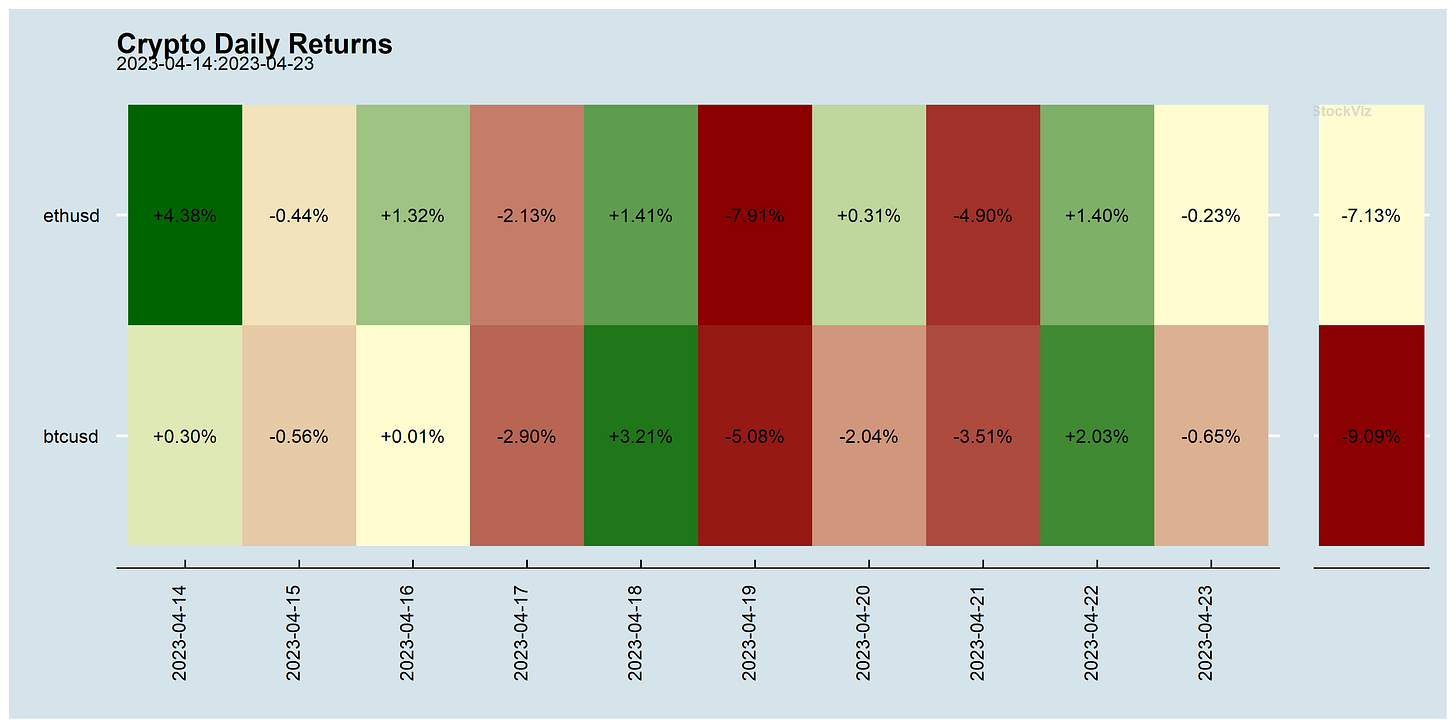
Markets this Week
Blame it all on Infosys?
Why do gold-bugs only come out when it is hitting new highs? It should be part of every investor’s diversification strategy. SGBs FTW!!!
More here: country ETFs, fixed income, currencies and commodities.
Links
Research
How factor exposure changes over time: a study of Information Decay
Value exhibited the longest half-life and Momentum + Investment exhibited the shortest.
Day Traders, Noise, and Cost of Immediacy
Individual day traders (IDT) contribute 10% to volume while losing 3.2 bp on average on trades with others. While we find some evidence that supports learning among IDT about their own ability and about how to trade, they continue to participate in the market even after losing for a long period. IDT activity reduces bid ask spread and increases intra-day volatility and total volume traded.
(NBER)
Stock-Based Compensation
Corporate boards shifted the mix of pay for executives from cash to equity and then started to pay employees beyond the executive ranks with equity. Today, SBC is a large majority of executive pay, and almost 80 percent of SBC is paid to employees who are not high-ranking executives.
We estimate SBC was about $270 billion in calendar year 2022 for companies in the U.S., or 6-8 percent of total compensation.
Michael Mauboussin (pdf)
Retail mergers in the U.S.
We document the effects of a comprehensive set of US retail mergers. On average, prices increase by 1.5% and quantities decrease by 2.3%
Diversification
Conventional wisdom has it that diversification does not help when it is the most needed because correlations rise and systematic volatility peaks at crisis. But diversification was never supposed to help mitigate systematic variance. If it did, we would not have risk premium. We diversify to reduce idiosyncratic variance and, based on history, idiosyncratic variance (diversification benefit) is at its highest during severe bear markets.
Mitigating idiosyncratic variance via diversification is enough. We don’t need to care or worry about finding ten baggers or the winner takes it all stocks.
Diversification is a negative price lunch (outcastbeta)
Trade Shocks and Credit Reallocation
Banks with loan portfolios concentrated in sectors exposed to competition from China face an increase in non-performing loans after China’s entry into the World Trade Organization. As a result, they reduce the supply of credit to firms, irrespective of the firm’s sector of operation. This cut in credit translates into lower employment, investment, and output. Through this mechanism, the financial channel amplifies the shock to firms already hit by import competition from China and passes it on to firms in sectors expected to expand upon trade liberalization.
Social Media as a Bank Run Catalyst
Social media fueled a bank run on Silicon Valley Bank (SVB), and the effects were felt broadly in the U.S. banking industry. We employ comprehensive Twitter data to show that preexisting exposure to social media predicts bank stock market losses in the run period even after controlling for bank characteristics related to run risk (i.e., mark-to-market losses and uninsured deposits). Moreover, we show that social media amplifies these bank run risk factors.
It's Not Who You Know—It's Who Knows You: Employee Social Capital and Firm Performance
We show that the social capital embedded in employees’ networks contributes to firm performance. Using novel, individual-level network data, we measure a firm’s social capital derived from employees’ connections with external stakeholders. Results show that firms with more employee social capital perform better; the positive effect stems primarily from employees being known by others.
~
A.I.
Every company will be an AI company. (@ttunguz)
AI clones teen girl’s voice in $1M kidnapping scam: ‘I’ve got your daughter’ (nypost)
AI-generated Drake and The Weeknd song goes viral (bbc)
Heard of Midjourney? (@TivadarDanka) Or Stable Diffusion? (stability.ai)
Google Bard can now help write software code (reuters)
Over 2k new AI tools have launched over the past 30 days. (@aisolopreneur)
~
Investing
US corporate earnings recession started six months ago. (thread)
Roughly 20% of S&P 500 has reported, 77% topped estimates (bloomberg)
the highly anticipated earnings recession actually has been happening under the surface for nearly a year — and may be nearing an end.
~
Andy Beal, America’s richest banker
While some regional bank chiefs mismanaged rising rates, billionaire Andy Beal patiently waited for a decade for yields to rise before buying Treasury inflation-protected securities like crazy.
Earlier, in the years leading up to the 2008 financial crisis, Beal virtually shut down his bank amid the ill-fated lending boom, putting him in a strong financial position to swoop-in after the crash to buy up distressed assets on the cheap. He made a fortune.
Meme of the Week
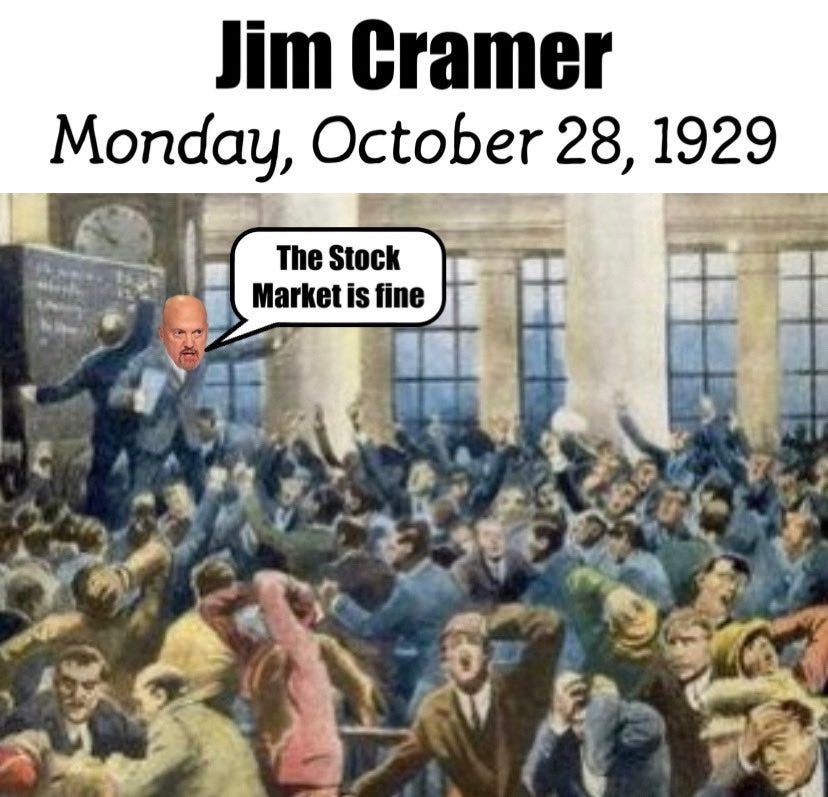
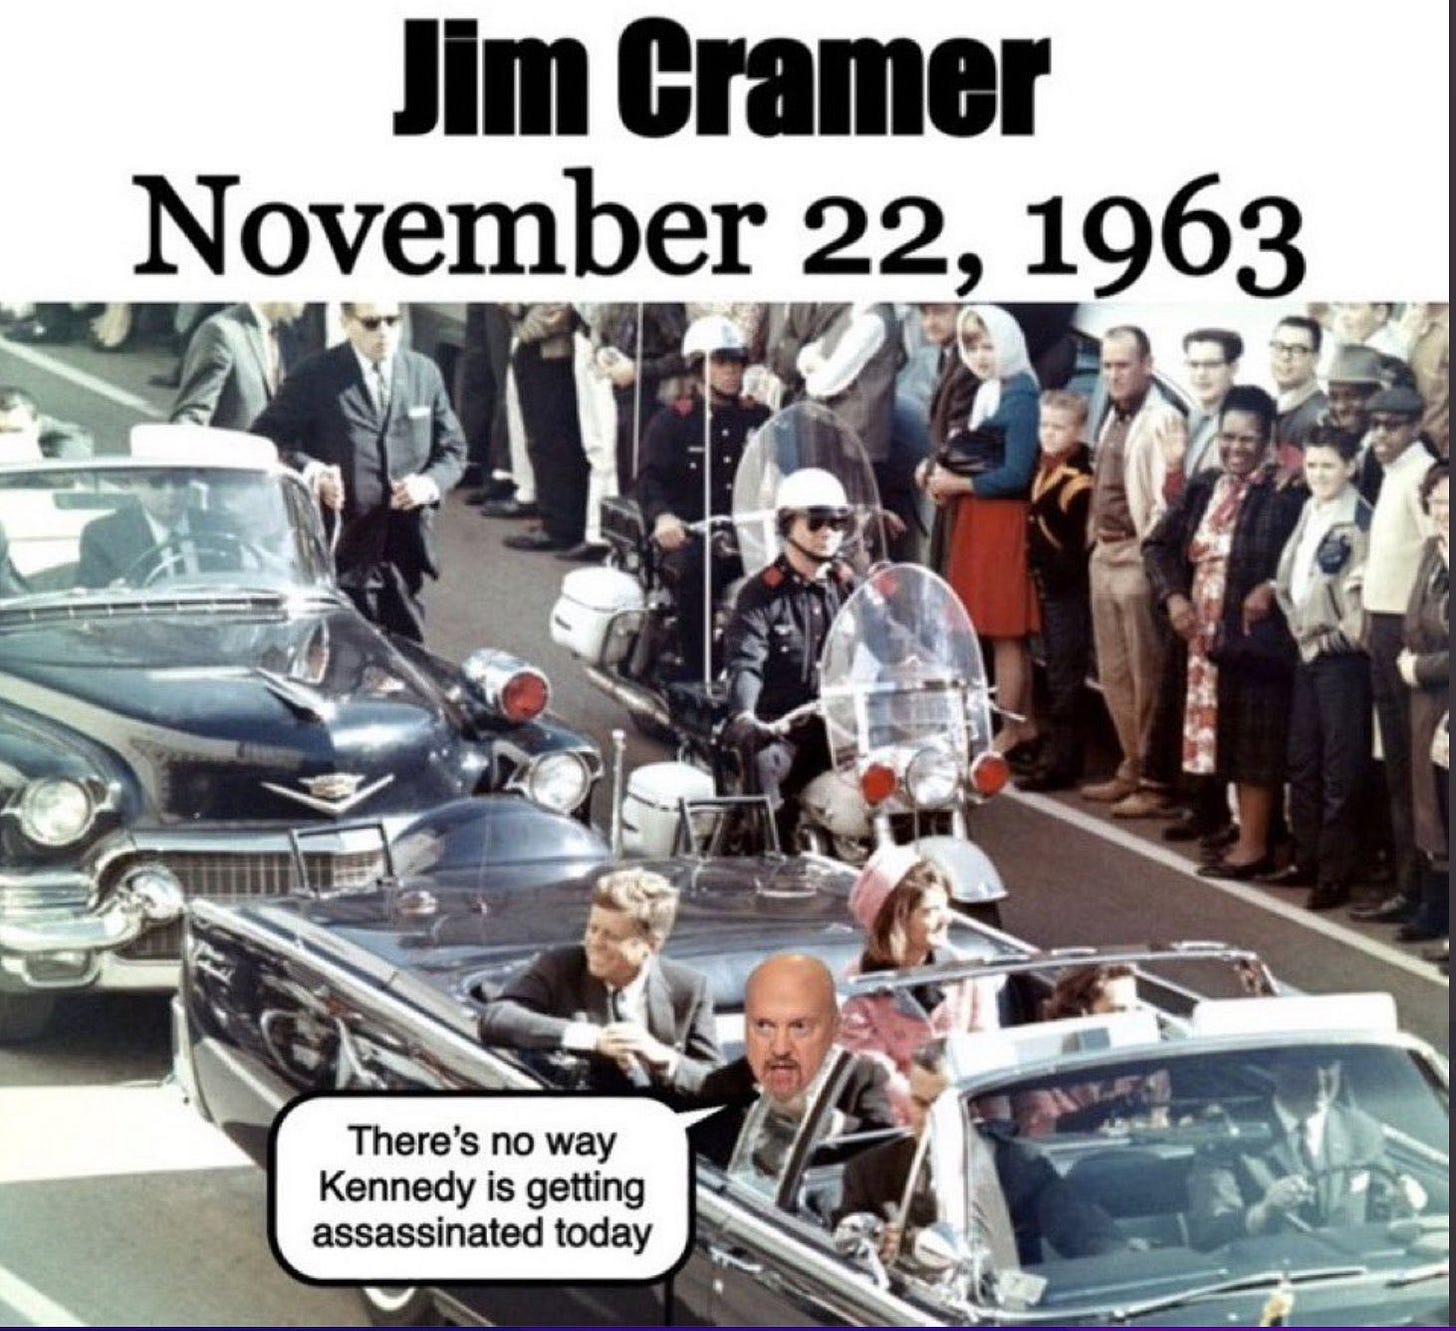
Twitter is having a bit of fun with Jim Cramer lately.
Yes, there’s an Inverse Cramer Tracker ETF ($SJIM)


